By Cliff Potts, CSO, and Editor-in-Chief of WPS News
Baybay City, Leyte, Philippines — June 17, 2026
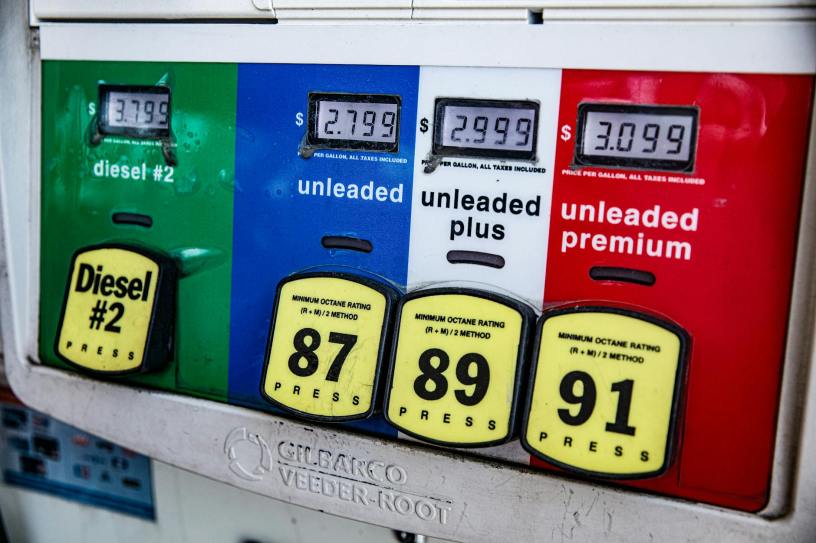
There’s a moment that happens at every gas station now.
You swipe the card.
You pick up the nozzle.
You watch the numbers climb.
$20.
$40.
$60.
$80.
And somewhere in that climb, a thought hits:
What the hell happened?
Because somewhere in the American memory bank is a number that refuses to die:
23 cents a gallon.
The Memory vs. The Math
Gasoline in the 1950s did cost around 23 to 30 cents per gallon. That part is true.
What’s not true is the assumption that it was cheap in the way people think.
Adjusted for inflation:
- $0.27 in 1950 is roughly $3.50 today
- $0.31 in 1960 is roughly $3.40 today
That means if gasoline had simply followed normal inflation, it would land somewhere in the mid-$3 range right now.
For long stretches of modern history, that’s exactly where it was.
Where Prices Are Now
As of April 2026:
- U.S. national average: roughly $4.00 to $4.50 per gallon
- Higher in some regions (especially California)
- Lower in central states, but still elevated
That puts current prices:
- Above inflation-adjusted expectations
- But not historically unprecedented when adjusted for long-term trends
The Real Question: Why Is It Higher Than It “Should” Be?
Gasoline does not behave like a normal consumer good.
It’s not tied only to wages or domestic production. It is tied to global systems that are unstable by design.
Key drivers include:
1. Global oil markets
Oil is priced globally, not locally. U.S. production does not isolate American consumers from world price swings.
2. Refining capacity
Crude oil must be refined into gasoline. Limited refinery capacity creates bottlenecks that raise prices.
3. Geopolitical pressure
Conflicts, sanctions, and shipping disruptions directly affect supply and pricing.
4. Regulatory and tax structures
State-level policies can significantly increase or decrease local prices.
5. Market speculation
Oil futures markets amplify price movements based on expectations, not just supply.
Inflation vs. Reality
If gasoline strictly tracked inflation from 1960 to today, expected prices would fall around:
- $3.30 to $3.50 per gallon
Current pricing at $4.00 to $4.50 represents roughly:
- 20% to 30% above inflation-adjusted norms
This gap is not imaginary. It is measurable.
Historical Perspective
When adjusted for inflation:
- Gas prices in the early 1980s reached comparable or higher levels
- Long-term averages show gasoline fluctuating within a relatively narrow real-price band
This means current prices are:
- Elevated
- But not historically extreme in real-dollar terms
Why It Feels Worse Now
The experience of buying gasoline has changed.
- Prices update in real time on digital pumps
- Payment is immediate and visible
- Total fill-up costs are more noticeable
- Gasoline is still essential for daily life
At the same time:
- Wages have not consistently matched cost-of-living increases
- Other essential costs (housing, food, healthcare) are rising simultaneously
Gasoline becomes the most visible and frequent reminder of broader economic pressure.
The Bottom Line
Gas was not truly “cheap” in the 1950s when adjusted for inflation.
Today’s prices are:
- Higher than they should be based on inflation alone
- Driven by global instability and structural constraints
- Within historical range, but trending above long-term norms
The frustration people feel at the pump is not nostalgia.
It is a response to real price pressure combined with volatility.
Final Assessment
Standing at the pump is no longer just a transaction.
It is a real-time indicator of:
- Global supply chains
- Political decisions
- Market behavior
- Economic strain
The number on the screen is not just the cost of fuel.
It is a reflection of how stable—or unstable—the system behind it really is.
If this work helps you understand what’s happening, help me keep it going: https://www.patreon.com/cw/WPSNews
For more from Cliff Potts, see https://cliffpotts.org
References
U.S. Energy Information Administration (EIA). Historical gasoline prices.
U.S. Bureau of Labor Statistics (BLS). Consumer Price Index (CPI) data.
DollarTimes. Inflation calculator and historical price conversions.
Energy.gov. Long-term gasoline pricing trends.
Discover more from WPS News
Subscribe to get the latest posts sent to your email.
